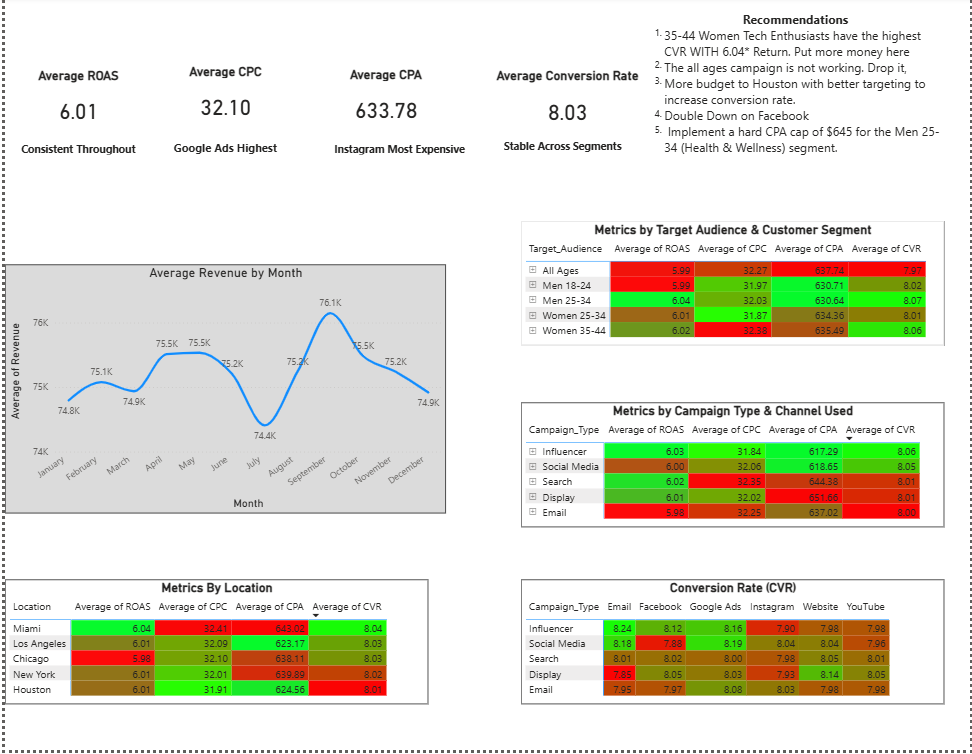
Power BI dashboard showing revenue trends and different metrics.
The Problem
A marketing team was running campaigns across multiple paid channels, but leadership had no visibility into which campaigns were truly profitable and which were wasting budget. Decisions were based on traffic volume rather than financial efficiency.
As the marketing analyst, the task was to evaluate campaign performance by calculating key KPIs — CTR, conversion rate, CPA, ROAS, and ROI — then identify which channels generate efficient returns, which underperform, and how budget should be redistributed.
Tech Stack
Python (Pandas)NumPySeabornPower BI Desktop12,000+ recordsROAS / CPA / CVRAttribution Modeling